
Bitcoin’s march is in full swing. During such runs, some investors hold the majority of their portfolios in BTC, while the others try to catch strong movements in altcoins with much lesser capitalizations. Active traders seek to timely switch between BTC and alts to increase the total value in BTC and not only in USD.
There are some fascinating patterns and interdependencies in the crypto world that may help you decide which strategy to employ.
Correlation
You’ve probably heard that cryptocurrencies are highly correlated and seen a matrix like that:
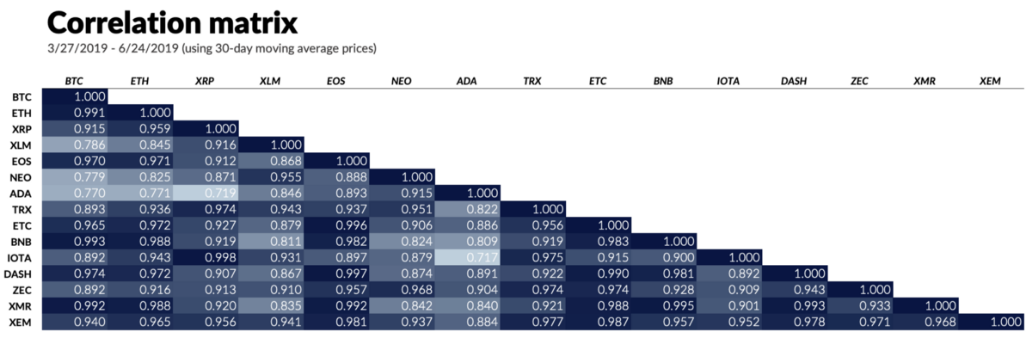
For those who have not. A correlation matrix is a table showing correlation coefficients between variables. The coefficient indicates the strength and direction of a linear relationship between two random variables. In our case, between the prices of two coins. A correlation coefficient is always between +1 and -1. A value of 0 indicates that there is no linear relationship between the prices of two coins. A value of +1 indicates that the prices perfectly mimic each other, a value of -1 is the same as +1 but the prices change in the opposite directions. In our example, the smallest coefficient is 0.717 between IOTA and ADA, it is considered a strong positive relationship.
The table shows some useful information:
“herd behavior”, major coins follow along pretty much the same path
diversification opportunities among the top coins are not that great since there is evidence of a strong positive relationship between them. To effectively diversify you need low/not high correlation among portfolio constituents.
The matrix, however, hides some important peculiarities of cash flow movements in crypto, which is going to be the main focus of this article.
The law of communicating vessels
Have ever noticed that when BTC is strong and is about to skyrocket, altcoins stand humbly in its shadow? Bitcoin literally siphons funds from other cryptocurrencies. When the run is over and BTC is on break, money flows back to altcoins which, in turn, come to the forefront quickly closing the gap. This pattern recurs consistently in the bull market. For a better understanding, let’s take a closer look at the recent surge of BTC in the context of some large-cap altcoins quoted against it.
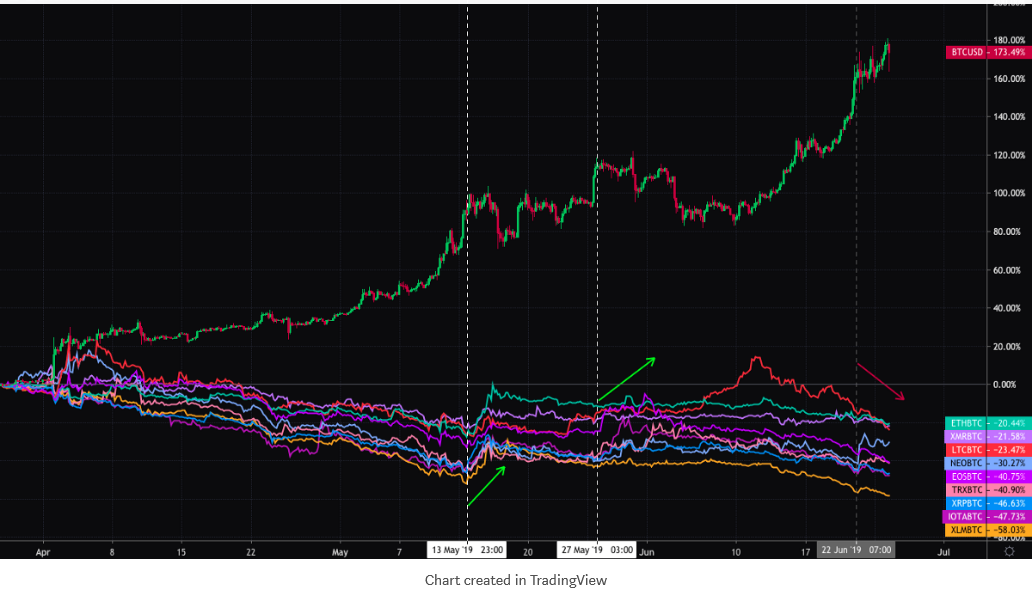
You can clearly see the phases in which BTC moves up absorbing money from the market and where it takes a break allowing altcoins to get their share of glory. Interestingly enough, this latest quick drop from $11,200 to $10,300 (22 Jun ’19) was not continued by the same reaction, altcoins further depreciate in BTC. Does it mean that the run isn’t over yet? According to this pattern
—
yes. Probably, by the time this article is published, the answer will be already plotted on the live chart. You can check it here (press the button on the chart to load new bars).
Hindsight
On the road to 20k in late 2017, the same pattern was present. Money has been moving between BTC and altcoins forming similar cycles.
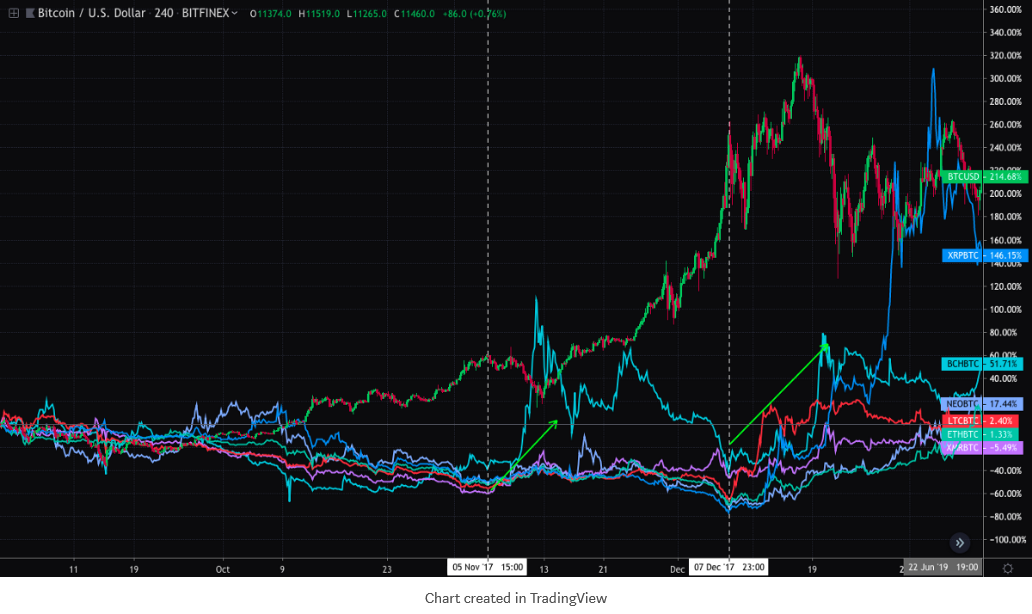
An obvious question: how it all ended up with respect to our observations?
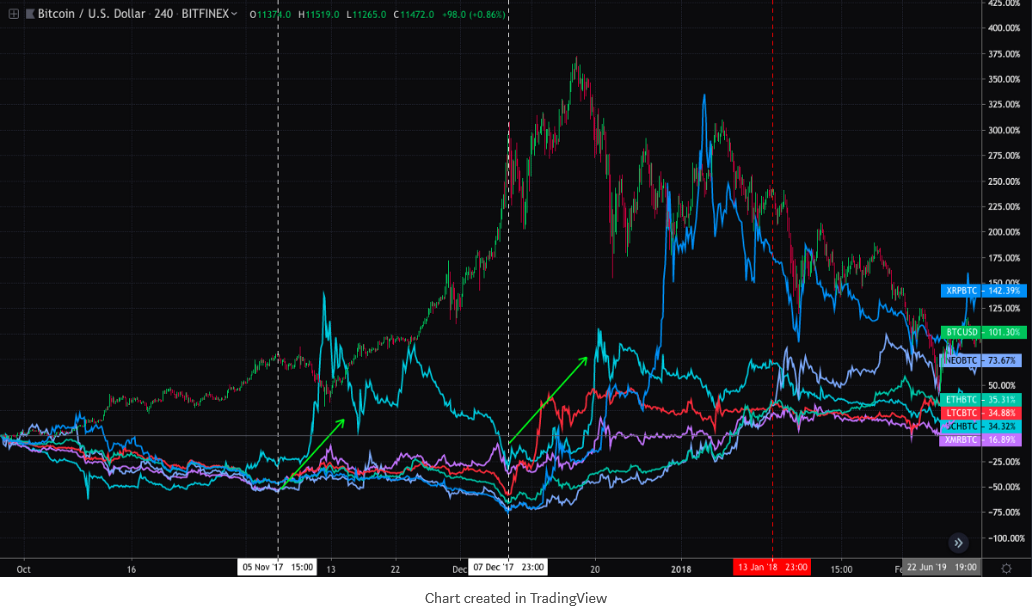
After 7 Dec ’17, beginning from a standard correction of BTC, altcoins started ignoring its further movements and were steadily appreciating in BTC. Around the red vertical line, where altcoins started entering the “green zone” against BTC the market finally collapsed. It does not mean that the next huge correction will be happening in the same way, however, when the pattern is broken, you should be especially cautious.
Conclusion
First, the charts above can help you understand in which state of a bull run we currently are. Second, if you are an active trader, this information may assist in the decision-making of whether to stay in BTC or switch to alts. This indicator should not be used as a decisive factor, but rather as a supplementary tool.
There are other intriguing aspects of money flows in crypto that are not covered in this article. This relates to how market manipulators force average traders to make mistakes by pumping BTC separately from altcoins, plus how they make additional profits with smaller initial cash outflow by knowing the order in which altcoins will be pumped. Maybe there will be an article on this topic too.
Sobering reminder
Looking at this crazy daily chart of BTC/USD and monitoring all this positive news you should be careful, the market is reaching its boiling point. Avoid leverage and decisions based on the feeling of missing opportunity, stay safe.
Handy links to stay tuned to our updates:
Website: https://blackmoonplatform.com
Telegram channel: https://t.me/blackmooncryptochannel
Facebook: https://www.facebook.com/blackmoonfg/
Twitter: https://twitter.com/BlackmoonFG
Reddit: https://www.reddit.com/r/BlackMoonCrypto/
DISCLAIMER
Investment in cryptocurrencies carries a high degree of risk and volatility and is not suitable for every investor; therefore, you should not risk the capital you cannot afford to lose. Please consult an independent professional financial or legal adviser to ensure the product meets your objectives before you decide to invest. Regional restrictions and suitability checks apply.
